Heating: DistrictHeatingsim
This notebook demonstrates how to use Districtheatingsim heating model to simulate heating loads for multiple buildings.
Imports
Import required libraries and set visualization defaults.
import os

import pandas as pd
import matplotlib.pyplot as plt

from entise.core.generator import Generator
from entise.constants import Types
from entise.constants import Columns as Cols
Load Data
We load building parameters from objects.csv and simulation data from the data folder.
# Load data
cwd = "."  # notebook runs inside examples/heat_demandlib

objects = pd.read_csv(os.path.join(cwd, "objects.csv"))

data = {}
common_data_folder = "../common_data"

for file in os.listdir(os.path.join(cwd, common_data_folder)):
    if file.endswith(".csv"):
        name = file.split(".")[0]
        data[name] = pd.read_csv(
            os.path.join(cwd, common_data_folder, file),
            parse_dates=True,
        )

print("Loaded data keys:", list(data.keys()))
Loaded data keys: ['weather']
Instantiate and Configure Model
Initialize the time series generator and configure it with building objects.
gen = Generator()
gen.add_objects(objects)

summary, df = gen.generate(data, workers=1)
100%|██████████| 10/10 [00:04<00:00, 2.16it/s]
Results Summary
Below is a summary of the annual heating demands (in kWh/a) and peak loads (W).
print("Summary:")
summary_kwh = (summary / 1000).round(0).astype(int)
summary_kwh.rename(columns=lambda x: x.replace("[W]", "[kW]").replace("[Wh]", "[kWh]"), inplace=True)
print(summary_kwh.to_string())
Summary:
    heating:demand[kWh]  heating:load_max[kW]
1                  5578                     3
2                 17015                     8
3                 10735                     6
4                 11792                     5
5                 34878                    17
6                 34877                    15
7                 52314                    24
8                  5185                     2
9                 23180                     9
10               106140                    41
Preparation of Data
# Pick the building to visualize (keep dtype consistent with summary index)
building_id = summary.index[0]

# Resolve object row (for dhw_share fallback)
objects_row = objects.loc[objects["id"] == building_id]
objects_row = objects_row.iloc[0] if not objects_row.empty else {}

# Resolve building dataframe
building_res = df[building_id] if building_id in df else df[next(iter(df.keys()))]
building_data = building_res[Types.HEATING].copy()
Separation of Space Heating and DHW
Define helper function to split total heating load into space heating and DHW components.
def _split_space_and_dhw_W() -> tuple[pd.Series, pd.Series]:
    """Return (space_W, dhw_W) in Watts."""
    timestep_s = (building_data.index[1] - building_data.index[0]).total_seconds()

    # Preferred: explicit kWh columns
    if "load_dhw[kWh]" in building_data.columns and "load_space[kWh]" in building_data.columns:
        dhw_W = building_data["load_dhw[kWh]"] * (3_600_000.0 / timestep_s)
        space_W = building_data["load_space[kWh]"] * (3_600_000.0 / timestep_s)
        return space_W, dhw_W

    # Alternative naming
    if "load_dhw[kWh]" in building_data.columns and "load_heating[kWh]" in building_data.columns:
        dhw_W = building_data["load_dhw[kWh]"] * (3_600_000.0 / timestep_s)
        space_W = building_data["load_heating[kWh]"] * (3_600_000.0 / timestep_s)
        return space_W, dhw_W

    # Preferred: explicit W columns
    if "heating:dhw_load[W]" in building_data.columns and "heating:space_load[W]" in building_data.columns:
        dhw_W = building_data["heating:dhw_load[W]"]
        space_W = building_data["heating:space_load[W]"]
        return space_W, dhw_W

    # Fallback: derive from total + dhw_share
    if "heating:load[W]" in building_data.columns:
        total_W = building_data["heating:load[W]"]
    elif "load_total[kWh]" in building_data.columns:
        total_W = building_data["load_total[kWh]"] * (3_600_000.0 / timestep_s)
    else:
        c = next(iter([c for c in building_data.columns if pd.api.types.is_numeric_dtype(building_data[c])]))
        total_W = building_data[c] * (3_600_000.0 / timestep_s)

    dhw_share = float(objects_row.get("dhw_share", 0.0)) if isinstance(objects_row, dict) else float(objects_row.get("dhw_share", 0.0))
    dhw_W = total_W * dhw_share
    space_W = total_W - dhw_W
    return space_W, dhw_W
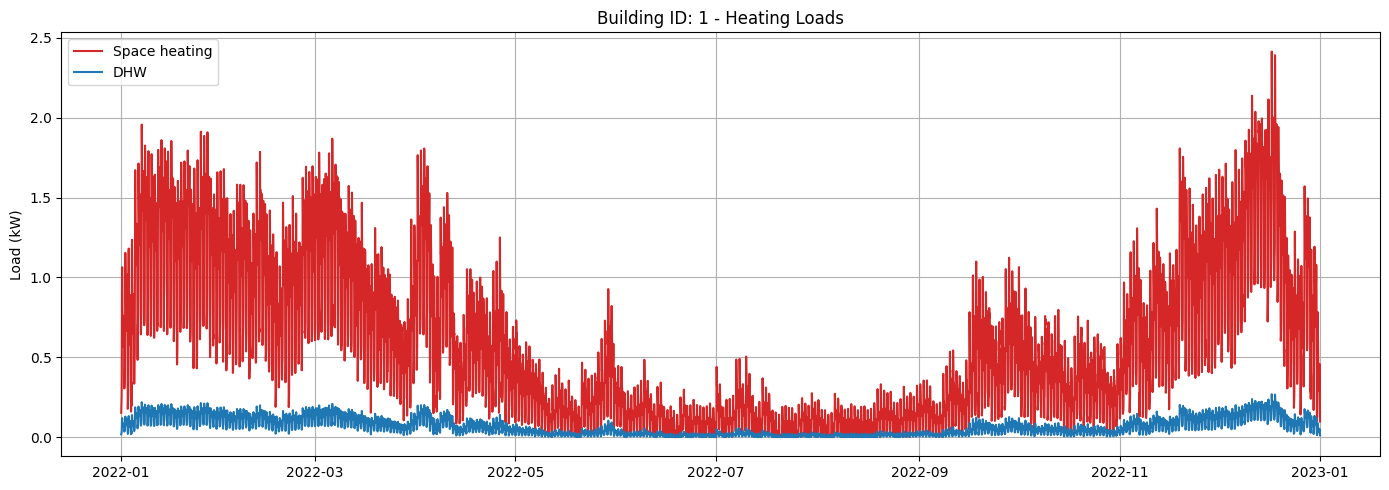
Visualization of Results
Visualize heatingloads for a selected building.
def plot_heating_loads():
    """Heating Loads (Space heating + DHW only; NO total)"""
    fig, ax = plt.subplots(figsize=(14, 5))

    space_W, dhw_W = _split_space_and_dhw_W()
    space_kW = space_W / 1000.0
    dhw_kW = dhw_W / 1000.0

    ax.plot(building_data.index, space_kW, label="Space heating", color="tab:red")
    ax.plot(building_data.index, dhw_kW, label="DHW")

    ax.set_ylabel("Load (kW)")
    ax.set_title(f"Building ID: {building_id} - Heating Loads")
    ax.legend()
    ax.grid(True)
    plt.tight_layout()
    plt.show()
plot_heating_loads()
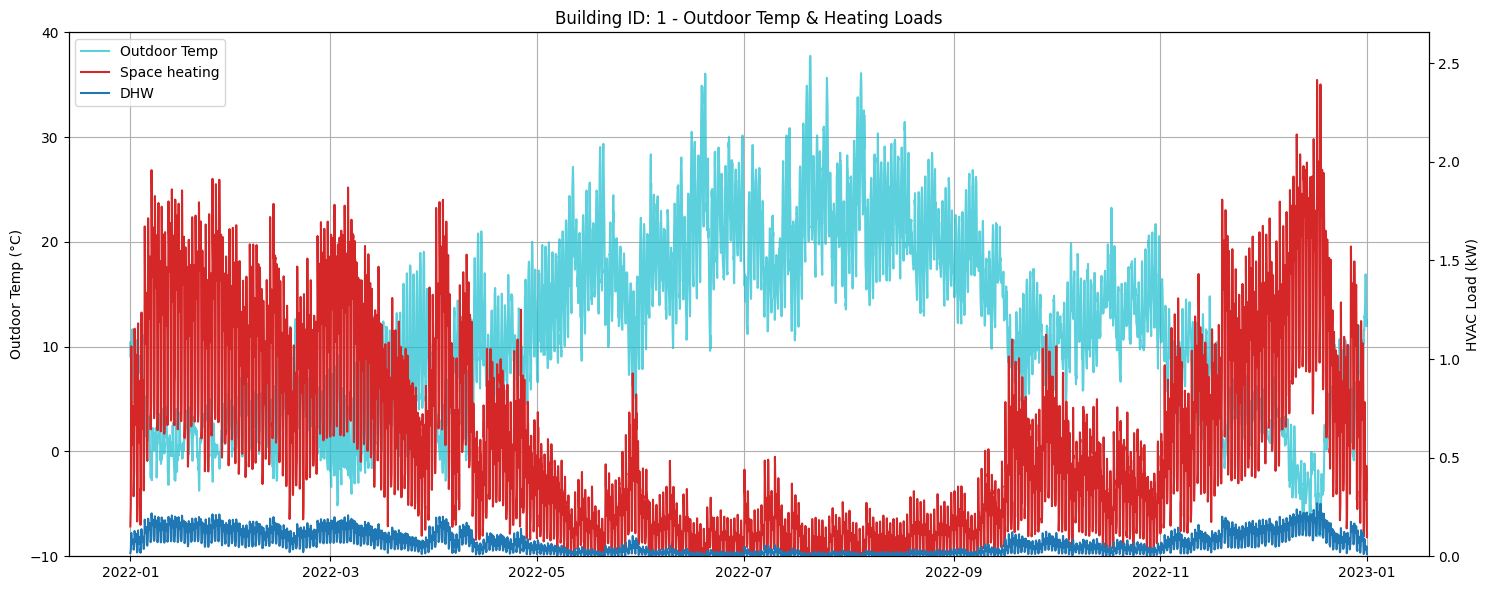
Outdoor Temperature with Heating Loads
Next, we visualize the outdoor temperature alongside the heating loads to see how they correlate.
def plot_outdoor_temp_with_loads():
        """Outdoor Temperature with Space heating + DHW (NO total)"""
        fig, ax1 = plt.subplots(figsize=(15, 6))

        air_temp = data["weather"][f"{Cols.TEMP_AIR}@2m"]
        ax1.plot(
            pd.to_datetime(building_data.index, utc=True),
            air_temp,
            label="Outdoor Temp",
            color="tab:cyan",
            alpha=0.7,
        )
        ax1.set_ylabel("Outdoor Temp (°C)")
        ax1.set_ylim(air_temp.min().round() - 2, air_temp.max().round() + 2)

        space_W, dhw_W = _split_space_and_dhw_W()
        space_kW = space_W / 1000.0
        dhw_kW = dhw_W / 1000.0

        ax2 = ax1.twinx()
        ax2.plot(
            pd.to_datetime(building_data.index, utc=True),
            space_kW,
            label="Space heating",
            color="tab:red",  # requested
        )
        ax2.plot(
            pd.to_datetime(building_data.index, utc=True),
            dhw_kW,
            label="DHW",
        )

        ax2.set_ylabel("HVAC Load (kW)")
        ax2.set_ylim(0, float(max(space_kW.max(), dhw_kW.max())) * 1.1)

        lines1, labels1 = ax1.get_legend_handles_labels()
        lines2, labels2 = ax2.get_legend_handles_labels()
        ax1.legend(lines1 + lines2, labels1 + labels2, loc="upper left")

        ax1.set_title(f"Building ID: {building_id} - Outdoor Temp & Heating Loads")
        ax1.grid(True)
        fig.tight_layout()
        plt.show()
plot_outdoor_temp_with_loads()